- BreakEven-Pannel
_EN_A control panel showing on the chart: the breakeven level, equity and symbol of the asset. Total sum of the buy/sell operations of each individual asset with respective breakeven level, then reports in total sum all outstanding operations so as to better manage the total closure by automatically counting the plus minus valuation._IT_Un pannello di controllo che riporta sul grafico: il livello di breakeven, equity e simbolo dell’asset. Somma totale dell’operatività buy/sell di ogni singolo asset con rispettivo livello di breakeven, riporta poi in somma totale tutte operazioni in essere così da poter gestire meglio la chiusura totale conteggiando automaticamente le plus minus valenze._DE_Ein Kontrollfeld, das auf dem Diagramm Folgendes anzeigt: die Gewinnschwelle, das Eigenkapital und das Symbol des Vermögenswerts. Die Gesamtsumme der Kauf-/Verkaufsgeschäfte jedes Vermögenswerts mit dem jeweiligen Break-Even-Level, meldet dann in der Gesamtsumme alle ausstehenden Geschäfte, so dass Sie den Gesamtabschluss besser verwalten können, indem Sie automatisch die Plus-Minus-Bewertung zählen.
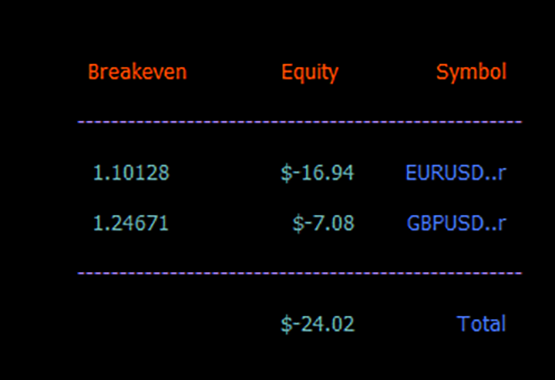
BreakEven
- DrivingGuide
_EN_Simple and intuitive, in 2 colours. Green for a bullish trend and red for a bearish trend. In addition to being a reliable trend-follower, this indicator carries a break-out function that occurs automatically with the interchange of the colour._IT_Semplice ed intuitivo, di 2 colori. Il verde per il trend rialzista ed il rosso per il trend ribassista. Questo indicatore oltre ad essere un Trend-follower affidabile porta con sé la funzione di break out che avviene in automatico con l’intercambio del colore._DE_Einfach und intuitiv, in 2 Farben. Grün für einen Aufwärtstrend und rot für einen Abwärtstrend. Dieser Indikator ist nicht nur ein zuverlässiger Trendfolger, sondern verfügt auch über eine Ausbruchsfunktion, die automatisch mit dem Farbwechsel erfolgt.
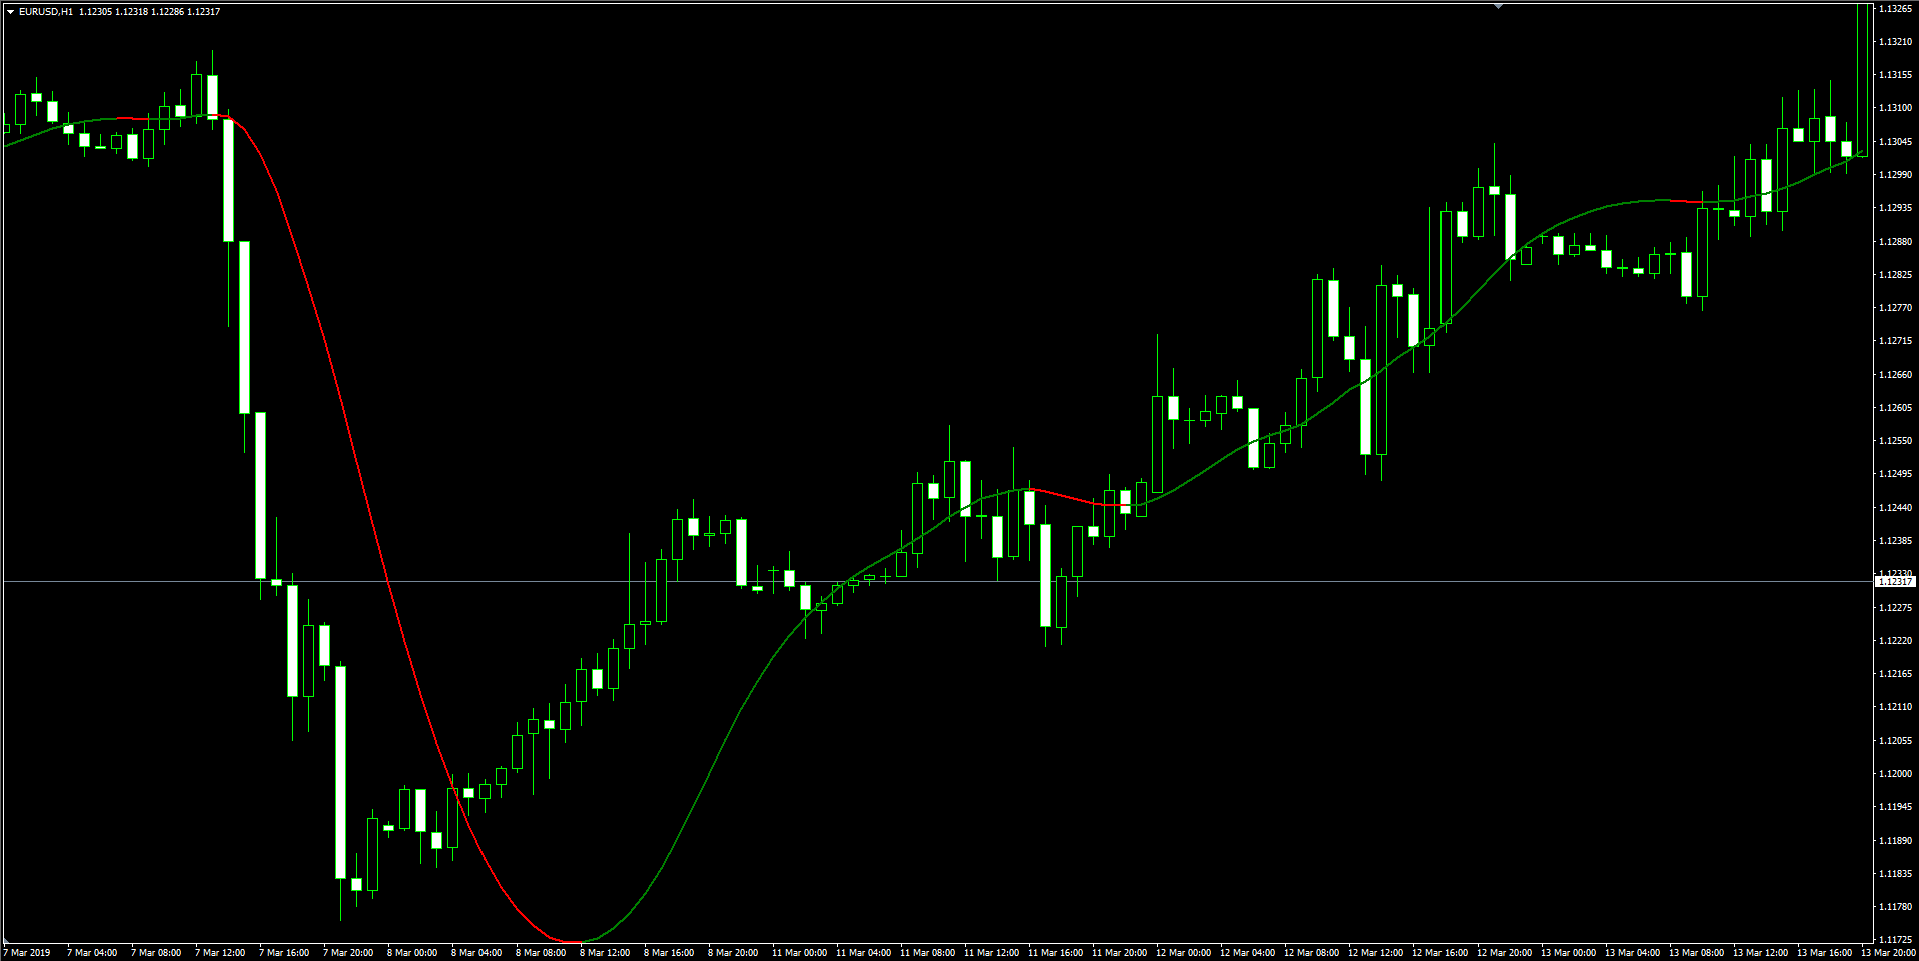
Grafico - DrivingGuide
- TripleTrendSignal
_EN_A triple signal with entry or exit levels. Trend, strength and momentum indications are respectively represented by a scale of 10 dots which, depending on the strength of the indication, increase in green or red to signal a possible continuation of the trend or reversal. This information is useful both for taking a position and for exiting the trade. Bearing levels are plotted on the chart and the indicator has a warning alert in the event of a signal._IT_Un segnale triplo con livelli di entry o exit. Le indicazioni di trend, forza e momentum sono raffigurate rispettivamente da una scala composta da 10 pallini che in base alla forza dell’indicazione aumentano in verde o rosso a segnalare una possibile continuazione del trend o inversione. Queste informazioni sono utili sia per prendere posizione e sia per uscire dal trade. Sul grafico vengono plottati dei livelli di orientamento e l’indicatore è dotato di allert di avviso in caso di segnale._DE_Ein dreifaches Signal mit Einstiegs- oder Ausstiegsebenen. Die Trend-, Stärke- und Momentum-Anzeigen werden jeweils durch eine Skala von 10 Punkten dargestellt, die sich je nach Stärke der Anzeige grün oder rot färben, um eine mögliche Trendfortsetzung oder -umkehr anzuzeigen. Diese Informationen sind sowohl für das Eingehen einer Position als auch für den Ausstieg aus dem Handel nützlich. Die Richtwerte werden auf dem Diagramm angezeigt, und der Indikator gibt im Falle eines Signals Warnmeldungen aus.

Grafico - TripleTrendSignal
- PivotScan
_EN_This simple indicator differs from the classic pivot levels in the possibility of a timeframe setting so that the pivot levels are not only daily but for example on H1._IT_Questo semplice indicatore si distingue dai classici livelli di pivots nella possibilità di un settaggio di timeframe così da avere i livelli di pivots non solo daily ma per esempio su H1._DE_Dieser einfache Indikator unterscheidet sich von den klassischen Pivot-Level durch die Möglichkeit der Einstellung eines Zeit Rahmens, so dass die Pivot-Level nicht nur täglich, sondern zum Beispiel auf H1 sind.

Grafico - PivotScan
- OverLine
_EN_The signal occurs when the quote crosses the green line, the respective red line being the SL level. The use of breakouts and support and resistance levels refine entry and exit and greatly increase the probability of a successful trade._IT_ Il segnale avviene quando la quotazione taglia la linea verde, la rispettiva linea rossa è il livello di SL. L’uso dei breakout e dei livelli di supporto e resistenza perfezionano entry ed exit e aumentano notevolmente la probabilità di riuscita positiva del Trade._DE_Das Signal tritt auf, wenn der Kurs die grüne Linie überschreitet, die entsprechende rote Linie ist das SL-Niveau. Die Verwendung von Ausbrüchen und Unterstützungs- und Widerstandsniveaus verfeinern den Einstieg und Ausstieg und erhöhen die Wahrscheinlichkeit eines erfolgreichen Handels erheblich.

Grafico - OverLine
- DynamicParallel
_EN_Statistical indicator consisting of a yellow channel parallel to the openprice, the red line’s outflow determines the buy/sell signal. The blue line is the respective statistical TP. The positioning of the levels is derived from a mathematical calculation of % of the last 3 days and is done on a daily close, and is always for the following day._IT_Indicatore statistico formato da un canale giallo parallelo rispetto all’openprice, la fuori uscita della linea rossa determina il segnale buy/sell. La linea blue è il rispettivo TP statistico. Il posizionamento dei livelli deriva da un calcolo matematico di % degli ultimi 3 giorni e avviene a close daily e sempre per il giorno successivo._DE_Statistischer Indikator, bestehend aus einem gelben Kanal parallel zum Eröffnungskurs; der Durchbruch der roten Linie bestimmt das Kauf-/Verkaufssignal. Die blaue Linie ist der jeweilige statistische TP. Die Positionierung der Levels ergibt sich aus einer mathematischen Berechnung der % der letzten 3 Tage und wird zum Tagesschluss und immer für den Folgetag vorgenommen.

Grafico - DynamicParallel
- DynamicParallel-Index
_EN_Statistical indicator formed by a yellow channel parallel to the openprice, the candlestick’s outflow determines the buy/sell signal. The blue line is the respective statistical TP. The positioning of the levels is derived from a mathematical calculation of % of the last 3 days and is done at close daily and always for the following day._IT_Indicatore statistico formato da un canale giallo parallelo rispetto all’openprice, la fuori uscita della candela determina il segnale buy/sell. La linea blue è il rispettivo TP statistico. Il posizionamento dei livelli deriva da un calcolo matematico di % degli ultimi 3 giorni e avviene a close daily e sempre per il giorno successivo._DE_Statistischer Indikator, der aus einem gelben Kanal parallel zum Eröffnungskurs besteht; die auslaufende Kerze bestimmt das Kauf-/Verkaufssignal. Die blaue Linie ist der jeweilige statistische TP. Die Positionierung der Niveaus ergibt sich aus einer mathematischen Berechnung des Prozentsatzes der letzten 3 Tage und erfolgt auf Tagesschlusskursbasis.

Grafico - DynamicParallel Index