- GDetector
_EN_The purpose of the indicator is to intercept the Gaussian bell on the graph by following, even if only on a theoretical basis, the normal distribution. Unlike a normal (standard) distribution shown on a graph, the distribution is exposed to accidental causality and is considered, on the basis of repetitive factors, a normal random variable used to describe errors, i.e.: Gaussian error distribution (error curve)._IT_Lo scopo dell’indicatore è intercettare sul grafico la campana Gaussiana seguendo, anche se solo in base teorica, la ripartizione normale. A differenza di una distribuzione normale (standard) riportata su un grafico la distribuzione è esposta a causalità accidentali e viene considerata, in base a fattori ripetitivi, variabile casuale normale usata per descrivere gli errori, ovvero: distribuzione gaussiana degli errori (curva degli errori)._DE_Der Zweck des Indikators besteht darin, die Gaußsche Glockenkurve auf dem Diagramm zu unterbrechen, wenn auch nur auf theoretischer Basis. Im Gegensatz zu einer grafisch dargestellten Normalverteilung (Standardverteilung) ist die Verteilung einer zufälligen Kausalität ausgesetzt und wird aufgrund von sich wiederholenden Faktoren als normale Zufallsvariable betrachtet, die zur Beschreibung von Fehlern verwendet wird, d. h.: Gaußsche Fehlerverteilung (Fehlerkurve).
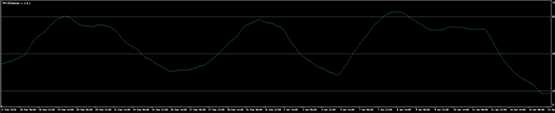
Grafico - GDectector
- DrivingGuide
_EN_Simple and intuitive, in 2 colours. Green for a bullish trend and red for a bearish trend. In addition to being a reliable trend-follower, this indicator carries a break-out function that occurs automatically with the interchange of the colour._IT_Semplice ed intuitivo, di 2 colori. Il verde per il trend rialzista ed il rosso per il trend ribassista. Questo indicatore oltre ad essere un Trend-follower affidabile porta con sé la funzione di break out che avviene in automatico con l’intercambio del colore._DE_Einfach und intuitiv, in 2 Farben. Grün für einen Aufwärtstrend und rot für einen Abwärtstrend. Dieser Indikator ist nicht nur ein zuverlässiger Trendfolger, sondern verfügt auch über eine Ausbruchsfunktion, die automatisch mit dem Farbwechsel erfolgt.

Grafico - DrivingGuide
- Fascia-Trend
_EN_This indicator intercepts the trend and considers it (series of histograms of the same colour) up to an inverse breakout level. The signal is purely technical and market entry occurs on breaking the first green/red histogram (beginning of trend band). The bands of green and red histograms have the function of determining trend phases._IT_Indicatore che intercetta il trend e lo considera (serie di istogrammi dello stesso colore) fino ad un livello di breakout inverso. Il segnale è prettamente tecnico e l’entry a mercato avviene a rottura del primo istogramma verde/rosso (inizio fascia di trend). Le fasce di istogrammi verdi e rossi hanno la funzione di determinare le fasi di trend._DE_Indikator, der den Trend abfängt und ihn (Reihe gleichfarbiger Histogramme) bis zu einem inversen Ausbruchsniveau betrachtet. Das Signal ist rein technischer Natur, und der Einstieg in den Markt erfolgt beim Durchbrechen des ersten grün/roten Histogramms (Beginn des Trendbands). Die Bänder der grünen und roten Histogramme haben die Funktion, Trendphasen zu bestimmen.
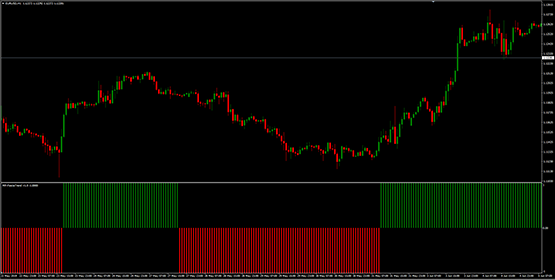
Grafico - Fascia Trend